


New Release: GIS Files of Water System Locations and Affordability Data


If you want to know how the affordability of drinking water and sewer rates compares between locations in New Jersey, you can now use spatial data from Jersey Water Works (JWW) to find out. What is “spatial data?” Simply put, it is a computer file (formatted as a shapefile) that includes a location, its shape, and various other attributes. In this case, the locations are the service areas of the state’s drinking water and sewer systems, and the attributes include information related to residents’ incomes and water/sewer rates. Those with GIS (geographic information systems) software can manipulate this data to answer questions such as, “Which areas in New Jersey have the biggest affordability issues?”
We’ve done our analysis. JWW developed this data as part of its new report, A New Jersey Affordability Methodology and Assessment for Drinking Water and Sewer Utility Costs, which assesses water and sewer affordability. This report presents a methodology for assessing the financial burden that drinking water and sewer utility costs impose on New Jersey households. It also provides the results from applying the methodology, using 2020 utility rate schedules and 2018 data on household incomes and expenditures. Given the importance of how affordability measures compare geographically, the report includes maps that display the results on statewide and regional levels. This report informs the collaborative’s progress in improving the affordability of water and sewer rates and provides affordability-related metrics for Jersey WaterCheck, JWW’s new data dashboard.
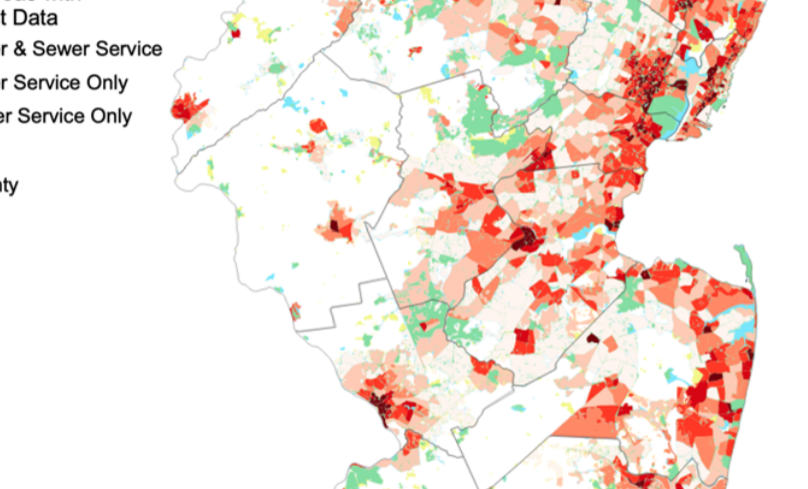
Now it’s your turn. For the first time, JWW is releasing shapefile data for the water service areas, sewer service areas, and water/sewer service area overlap, so others can analyze it. They were made using a GIS tool called QGIS, an open source application that is used to view, edit, and analyze geospatial data. The shapefiles for the base maps, such as the water and sewer service areas, were obtained from the New Jersey Geographic Information Network (NJGIN) Open Data portal. The affordability data (i.e., percentages of households that may struggle to pay water and sewer utility bills) were imported via a spreadsheet and then joined to the appropriate base map layer using geographic identifiers (e.g., NJPDES number). Then, the data was displayed using graduated symbology (i.e., increasingly darker shades from 1-10% to 10-20%, and so on) at the level of the given spatial unit (e.g., sewer service area).
Jersey WaterCheck is committed to data transparency. When research reports are published, sometimes the raw data accompanies it, depending on the need for data privacy. This data typically comes in the form of numbers in a spreadsheet or interview transcripts, for example. Given the importance of visualizing certain results geographically, data in a spatial format can be useful to provide, as well. That is what JWW has done by making the shapefiles available. You can find the document with descriptions of and links to the relevant shapefiles in the Documents Library on the Jersey WaterCheck website.
Anyone who downloads the shapefile can upload it into a mapping application, such as ArcGIS or QGIS, and analyze it depending on their interests. They can modify it to highlight or only include certain areas, as well as overlay it with other data layers and conduct analyses that compare the affordability numbers to the data in those other layers. Of course, in addition to manipulating the data, they can produce their own maps and present them for various purposes. The possibilities with shapefiles, as with spreadsheets, are endless and are essential to maintaining data transparency and sharing knowledge.


